 Zudo Works
Dashboards, widgets and module reports
Where: Settings → Low-code → Dashboards (/dashboards, /dashboards/<id>); Saved reports on module pages [dashboards.read; build dashboards.manage]
The widget model (shared by dashboards, module reports and home charts)
| Setting | Options |
|---|---|
| Source | a custom form (its fields, subform counts, or an expanded subform) or a core dataset: sales_orders, sales_order_lines, purchase_orders, items, stock_balances, work_orders, stock_movements, customers (whitelisted columns, tenant-scoped, permission-checked) |
| Chart (20) | bar, horizontal bar, stacked bar, line, area, stacked area, combo, waterfall, pie, donut, rose, funnel, scatter, heatmap, radar, treemap, gauge, KPI, pivot, table |
| Dimension | a column, with a date bucket (day, week, month, quarter, year) for dates; omitted → one total (KPI, gauge) |
| Series | second grouping (stacks, heatmap rows, pivot columns) |
| Measures | 1–5 of count, count_distinct, sum, avg, min, max with labels |
| Filters | up to 20: eq, neq, gt, gte, lt, lte, contains, in, between, empty, not_empty |
| Sort, limit | dimension / value asc or desc; ≤ 2,000 rows |
| Mode | aggregate, or raw (one point per record — scatter) |
| Options | linear trendline, legend, labels, smooth lines, gauge max / KPI target, colour |
| Layout | 12-column grid: x, y, width 1–12, height 1–24 (drag to move, corner handle to resize) |
Dashboards hold up to 40 widgets and 10 dashboard-level filters (date range, value or text, bound to a field in each target widget). Click a chart point to drill down into the raw rows (paginated). Sidebar… places a dashboard in the main sidebar.
Module reports live on Items, Customers, Jobs, Sales orders, Purchase orders, Balances and Movements: up to 20 per module; one shows as a hero section, several as numbered tabs. Each report carries up to 8 buttons: Export CSV, Export PDF (print), Run workflow (a report_button rule gets the filtered rows). The sidebar [R] button opens them directly.
The sidebar Form and Report buttons
Hovering a sidebar entry shows two small buttons. Form opens only that section's new-record form (a new item, customer, sales order, job, or a custom form's new record). Report (tooltip "Records and reports of …") opens only its reports: one report fills the page; several are listed in a table to choose from (/reports/<module>); none yet → designers start one.
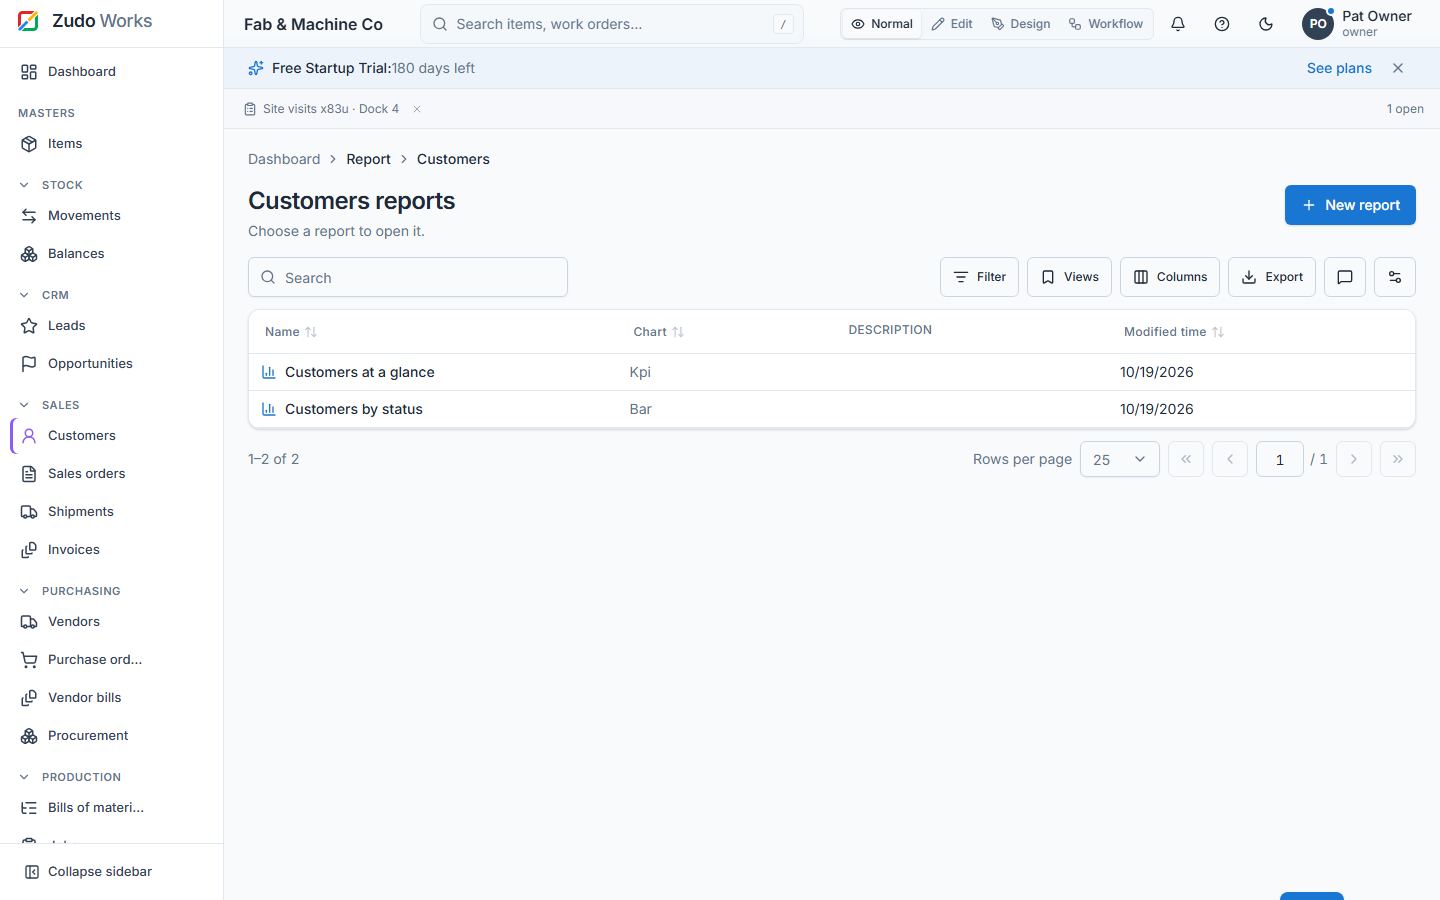
Table reports (list reports)
A table report lists records in the columns you choose — over a custom form or over a list page's data (items, customers, work orders, sales and purchase orders, stock balances, stock movements). Build one from Settings → Reports → New report (pick the form or section, then Table), from the sidebar + → New report, or from a report page's New table report:
- Columns in your order (none ticked = every column, including Added time and Modified time); filters the rows must match (is, is not, greater / less than, contains, one of, between, empty, not empty); a default sort and a grouping.
- Buttons (Creator's custom actions): Export CSV, Print, Run workflow rule (a rule with the Report button trigger gets the ticked rows or every row shown), Set fields on the rows (choose fields and values; the ticked rows are changed like an edit — field access, validation and record workflows apply; works on every report, see Buttons on any report below), Open a link (
{field}placeholders take the first ticked row's values). - Who can open it: tick roles to limit the report; none = everyone who may read the data. Reading the data itself always needs the dataset's permission (
forms.read,masters.read…). - In the report: every column sorts, the quick filter row and filter builder narrow the rows, grouping, summary row, saved views, CSV export, Import (form reports and Items / Customers / Vendors), tick rows for the buttons, click a row to open the record. Up to 2,000 rows load into the browser; a note says so when a filter is needed.
- Duplicate copies a report ("Copy of …") to start from; Settings → Reports lists every saved report with its source and type, and every form's records table.
Form records pages (/forms/<slug>) show every field as a column — a field added later appears at once — and sort on every column on the server.
Zudo AI builds table reports too: "a report of Inspections with status open, in the Quality section" proposes columns, filter, sort and buttons for you to approve (§54).
Buttons on any report
Set fields and Run workflow rule buttons work on every table report — a custom form's, and every built-in section's: Items, Customers, Vendors, Warehouses, Work centres, Jobs, Sales orders and Purchase orders (stock balances and movements have nothing a button can change).
- On a section's report a set-fields button can change the section's custom fields (every field you added to the section's form, e.g. a checkbox Allow Movements on Items) and these built-in fields: Items — name, type, material grade, thickness, dimensions, standard cost, description; Customers — name, phone, billing and shipping address, notes; Vendors — name, phone, address, payment terms, notes; Warehouses — name, notes; Work centres — name, machine type, hourly rate; Jobs — quantity, due date, customer reference, operations, notes; Sales orders — due date, customer reference, notes; Purchase orders — expected date, vendor reference, notes. Codes, numbers, linked records and order lines are never changed by a button.
- The value input follows the field: a tick box for a checkbox, the options of a choice field, a number, a date or text. Leave a value empty to clear the field (required fields cannot be cleared). Add an optional question ("Allow movements for the ticked items?") and choose whether the button changes the ticked rows or every row shown.
- Pressing it changes each row exactly like editing it: you need the section's edit permission (Items:
masters.write; Customers / Sales orders:sales.write; Vendors / Purchase orders:purchasing.write; Jobs / Work centres:jobs.write; form reports:forms.write), the same validation applies, and a row that cannot change (a confirmed sales order, a completed job) is reported while the others still change. Custom-field values are merged into what the record already has. One audit-log entry records the run (report.button). - A workflow button runs a rule with the Report button trigger (Workflows → New rule) on the rows, on any report, built-in sections included.
- Zudo AI adds these buttons too: "add a button on the Items report that sets Allow Movements to yes" proposes an Items table report with that button; it lands in the section you name, or the report's own section (Items → Masters). It can also add a workflow button for an existing Report button rule; creating the rule itself stays with you.
Call a report from the API
Every report has an API name (its link name), shown as a chip next to the report's title with Copy API URL. It is made from the name when the report is created (Open orders (Q3) → open_orders_q3; a taken name gets _2, _3) and stays the same when the report is renamed, so scripts keep working; change it in the report designer (API name, or Regenerate from name). Letters, digits and underscores, starting with a letter, at most 60. Names starting with all_ belong to the built-in "All …" reports: all_items, all_customers, all_work_orders, … and all_form_<slug> for a custom form. A copy gets <api_name>_copy.
Call it with an API key (Settings → Developer → API keys) that has the dashboards.read scope plus the section's read permission (masters.read for items, forms.read for forms …):
curl -H "Authorization: Bearer zk_…" "https://api.zudoworks.com/api/v1/reports/by-name/open_orders_q3/rows?limit=100&offset=0"The answer is { report: { id, name, api_name, module }, columns: [{ name, label, type }], rows, total, limit, offset }. A table report answers its rows in its own columns (every row also carries id), with its filters and order; a chart report answers the rows its chart draws (dimension, series, then m0, m1 … per measure). Query string: limit (1–500, default 50), offset, sort (a column) and dir (asc/desc), filters (a JSON list of { "field", "op", "value" }, the same operators as the report filters). Report roles apply: a report limited to roles answers 403 to others. Settings → Developer → API reference lists every report you may open with its API name and endpoint, plus the record endpoints of forms and sections.
Last updated