 Zudo Works
How to build a dashboard and add a chart
Put charts and key figures over any section or custom form on one page — click a bar later to see the records behind it.
- In the sidebar, open Settings; under Forms & automation press Dashboards.
- Press New dashboard, type a Name (e.g. "Quality overview") and press Create. The new dashboard opens ready to edit.
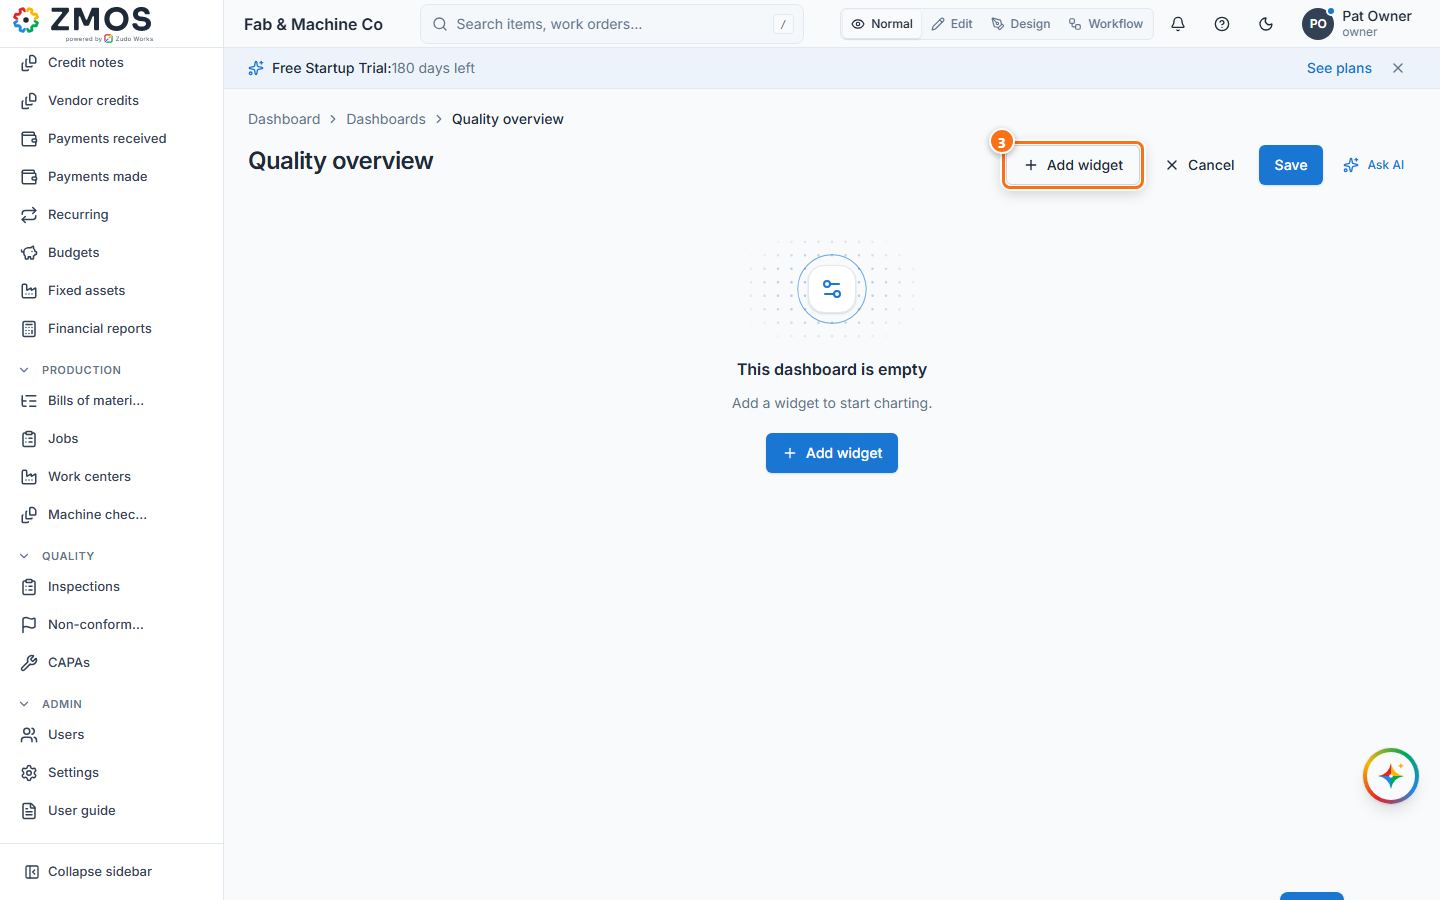
- Press Add widget.
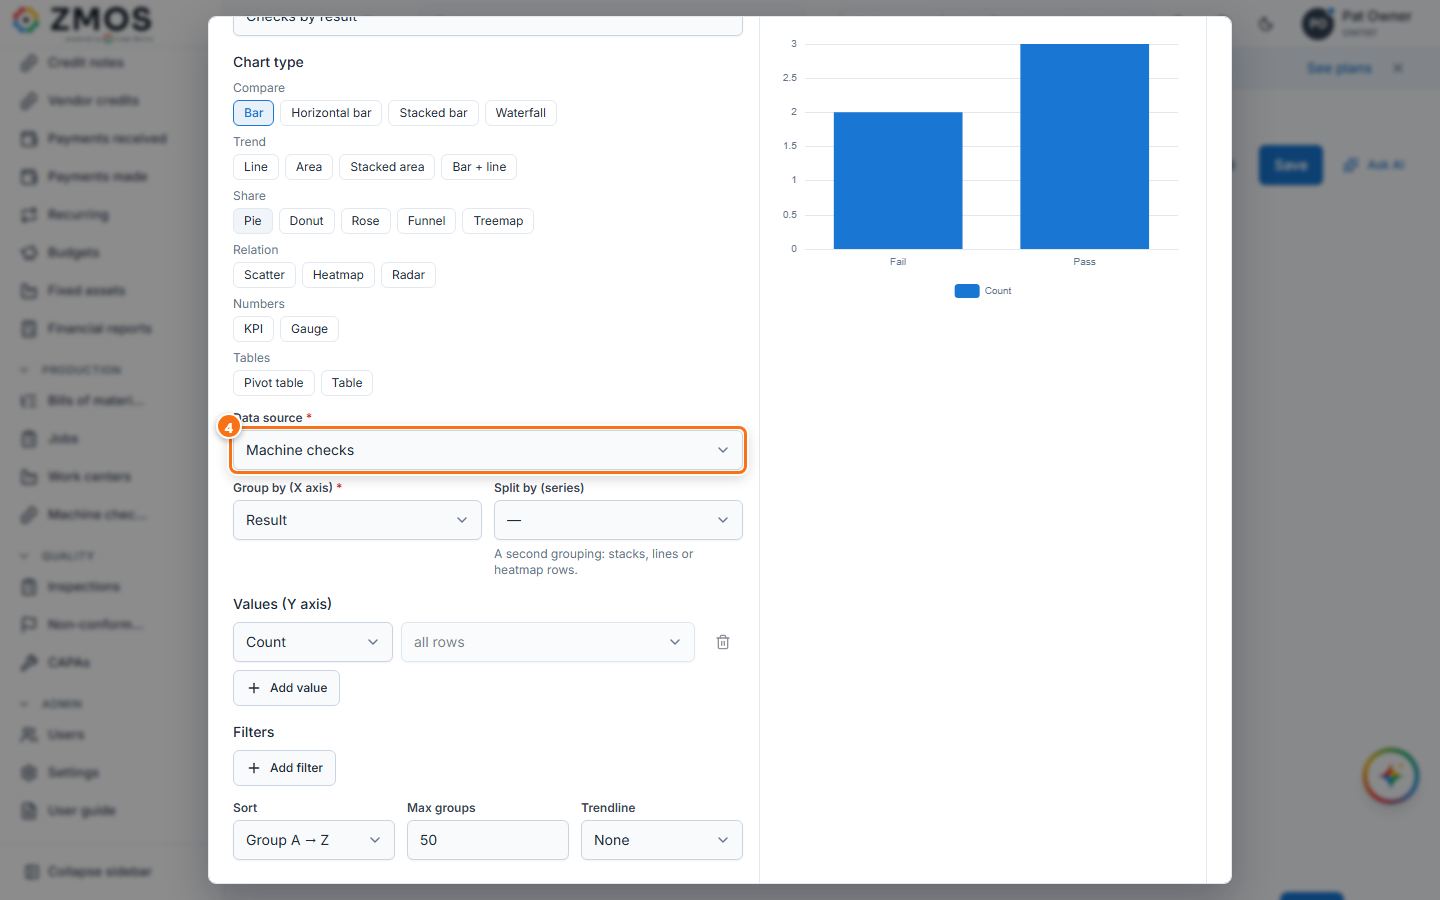
- Type a Title (e.g. "Checks by result"), choose the Chart type (e.g. Bar), pick the Data source — ERP data or one of your Custom forms — and Group by (X axis) (e.g. Result). Values (Y axis) count the rows unless you choose otherwise; the Preview on the right follows every change.
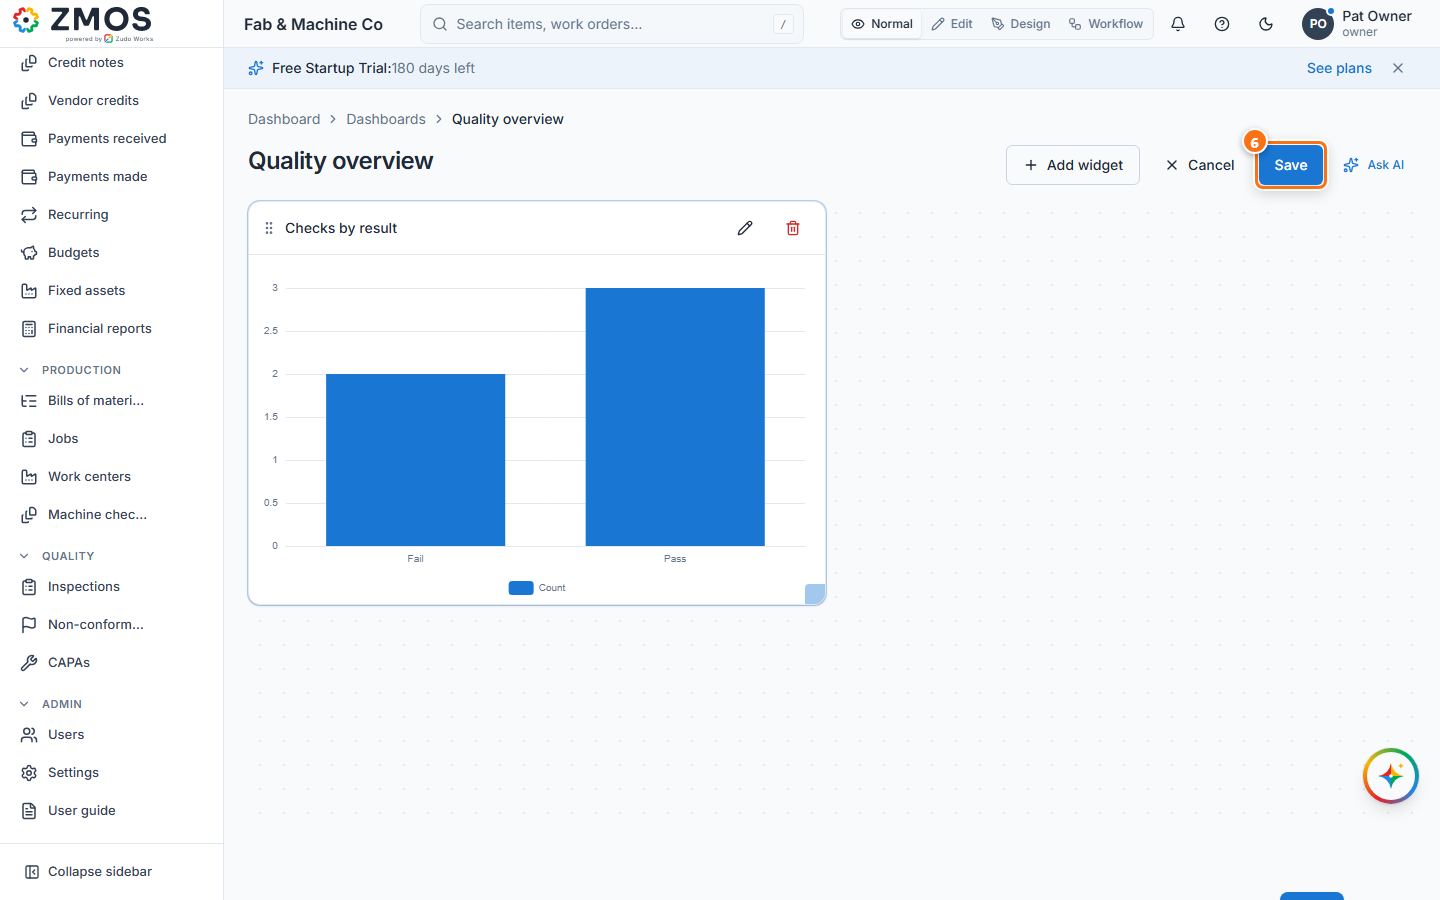
- Press Add widget at the bottom of the dialog. Drag a widget's corner to resize it; add more widgets the same way.
- Press Save. "Dashboard saved" confirms it. Edit layout changes it later and Sidebar… places it in the sidebar.
Last updated